
Global Market Commentary – A Very Volatile April
- May 5, 2025
- 10 min read
Global Markets Struggle in April
April was a turbulent month for U.S. stock markets, marked by sharp declines and a surge in volatility. The tone was set on the final day of the month, when data revealed that U.S. GDP contracted by 0.3% in Q1 – its first decline in over three years. The contraction was largely driven by a surge in imports ahead of newly imposed tariffs, which widened the trade deficit.
Uneven corporate earnings added to investor concerns. A few high-profile companies missed expectations, and falling oil prices weighed heavily on the energy sector. Coupled with soft economic data, these developments reignited fears of a potential recession. In response, major banks such as Goldman Sachs and JPMorgan raised their recession probabilities to 45%. Meanwhile, inflation came in better than expected, complicating market expectations for Federal Reserve rate cuts.
Investor anxiety spiked amid mounting political and economic uncertainty. The VIX soared, reflecting deep unease following President Trump's April 2 announcement of sweeping “Liberation Day” tariffs – a 10% baseline on all imports, with even steeper rates targeting China, the EU, and Japan.
For the month of April:
The DJIA dropped 3.2%;
The S&P 500 lost 0.8%;
NASDAQ gained 0.9%; and
The Russell 2000 pulled back 2.4%.
Unlike U.S. markets, developed markets abroad saw strong gains in April, with 35 of 37 MSCI indices rising. Emerging markets were more mixed, with 34 of those 46 indices advancing.
Volatility surged broadly, with the VIX climbing more than 11% over the month. A sharp spike of over 150% early in the month highlighted intense market anxiety surrounding tariffs.
West Texas Intermediate crude oil fell steadily throughout the month, dropping over $13 to settle at $58.26 per barrel – an 18% decline and its lowest level since February 2021
Market Performance Around the World
Investors who looked beyond the U.S. saw strong results, with 35 of 37 MSCI-tracked developed markets posting gains – 15 of them rising more than 4%. In slight contrast, emerging markets were not as positive, as 34 of those 46 MSCI indices advanced for the month.
Index Returns | April 2025 |
MSCI EAFE | +4.17% |
MSCI EURO | +4.35% |
MSCI FAR EAST | +4.44% |
MSCI G7 INDEX | +0.41% |
MSCI NORTH AMERICA | -0.40% |
MSCI PACIFIC | +4.91% |
MSCI PACIFIC EX-JAPAN | +4.26% |
MSCI WORLD | +0.74% |
MSCI WORLD ex USA | +4.17% |
Source: MSCI. Past performance cannot guarantee future results
Sector Performance Was Mixed
Sector performance in April showed a mixed picture, with 6 of the 11 S&P 500 sectors ending the month in negative territory. This marked a modest improvement over March, when 9 of the 11 sectors posted losses – three of which declined by more than 7%. April’s outcome more closely resembled February, when 6 sectors advanced, but stood in sharp contrast to January, a particularly strong month during which 10 sectors gained and 4 rose by more than 5%.
From a relative standpoint, April represented a step forward, as 9 sectors outperformed their March results. Notable among them were Information Technology and Energy, both of which experienced significant reversals. These dramatic month-to-month swings underscore the ongoing volatility and uncertainty that continue to influence market dynamics.
The dispersion in returns also highlighted the uneven market environment. The Energy sector, for instance, suffered a sharp 13% drop in April after posting a 4% gain in March. This kind of intra-sector divergence reflects the complexity of current macroeconomic and policy forces impacting different parts of the market.
Below are the sector returns for April and March, reflecting these short-term fluctuations:
S&P 500 Sector | March 2025 | April 2025 |
Information Technology | -7.34% | +1.61% |
Energy | +4.22% | -12.81% |
Health Care | -1.53% | -2.96% |
Real Estate | -3.07% | -0.48% |
Consumer Staples | -3.08% | +2.73% |
Consumer Discretionary | -7.21% | -0.52% |
Industrials | -3.04% | +0.79% |
Financials | -3.54% | -0.99% |
Materials | -3.10% | -1.19% |
Communication Services | -7.32% | +0.84% |
Utilities | +0.40% | +1.11% |
Source: FMR
Tariffs Dominate Wall Street’s Woes
On April 2, 2025, President Donald Trump unveiled the "Liberation Day" tariffs, marking a significant shift in U.S. trade policy. This initiative introduced a universal 10% tariff on all imported goods, with higher "reciprocal" rates for specific countries: 54% on Chinese imports, 20% on goods from the European Union, and 24% on Japanese products . These measures aimed to address perceived trade imbalances and protect domestic industries by encouraging local production and reducing reliance on foreign imports.

The international response was swift and assertive. China condemned the U.S. action as a violation of World Trade Organization rules and promptly imposed retaliatory tariffs of 34% on U.S. goods, filed a WTO complaint, and restricted critical exports like rare earths . The European Union and Japan also expressed strong opposition, with the EU considering countermeasures and Japan seeking consultations to address the escalating trade tensions.
In North America, the situation was complex. Canada and Mexico were initially exempted from the universal 10% tariff due to existing USMCA agreements. However, both countries faced a separate 25% tariff on certain imports, including automobiles and auto parts, justified by the U.S. administration as measures to address issues related to illegal immigration and drug trafficking . Canadian Prime Minister Mark Carney criticized the tariffs as unjustified and harmful, pledging to implement retaliatory measures to protect Canadian interests. Mexico's President Claudia Sheinbaum engaged in negotiations, resulting in a temporary delay of tariffs on USMCA-compliant goods, though tensions remained high as discussions continued.
Real GDP Slows Way Down in Q1
Real gross domestic product (GDP) decreased at an annual rate of 0.3% in the first quarter of 2025 (January, February, and March), according to the advance estimate released by the U.S. Bureau of Economic Analysis. In the fourth quarter of 2024, real GDP increased 2.4%.

The decrease in real GDP in the first quarter primarily reflected an increase in imports, which are a subtraction in the calculation of GDP, and a decrease in government spending. These movements were partly offset by increases in investment, consumer spending, and exports.

Compared to the fourth quarter, the downturn in real GDP in the first quarter reflected an upturn in imports, a deceleration in consumer spending, and a downturn in government spending that were partly offset by upturns in investment and exports.
Real final sales to private domestic purchasers, the sum of consumer spending and gross private fixed investment, increased 3.0% in the first quarter, compared with an increase of 2.9% in the fourth quarter.
The price index for gross domestic purchases increased 3.4% in the first quarter, compared with an increase of 2.2% in the fourth quarter. The personal consumption expenditures (PCE) price index increased 3.6%, compared with an increase of 2.4%. Excluding food and energy prices, the PCE price index increased 3.5%, compared with an increase of 2.6%.

Inflation Decreased in March
The Consumer Price Index for All Urban Consumers (CPI-U) decreased 0.1% on a seasonally adjusted basis in March, after rising 0.2% in February, the U.S. Bureau of Labor Statistics reported today. Over the last 12 months, the all items index increased 2.4% before seasonal adjustment.

The index for energy fell 2.4% in March, as a 6.3-percent decline in the index for gasoline more than offset increases in the indexes for electricity and natural gas. The food index,
in contrast, rose 0.4% in March as the food at home index increased 0.5% and the food away from home index rose 0.4% over the month.
The index for all items less food and energy rose 0.1% in March, following a 0.2-percent increase in February.
Indexes that increased over the month include personal care, medical care, education, apparel, and new vehicles. The indexes for airline fares, motor vehicle insurance, used cars and trucks, and recreation were among the major indexes that decreased in March.
The all items index rose 2.4% for the 12 months ending March, after rising 2.8% over the 12 months ending February. The all items less food and energy index rose 2.8% over the last 12 months, the smallest 12-month increase since March 2021. The energy index decreased 3.3% for the 12 months ending March. The food index increased 3.0% over the last year.
Earnings, Earnings, Earnings
According to research firm FactSet, as of April 25th for Q1 2025 (with 36% of S&P 500 companies reporting actual results), 73% of S&P 500 companies have reported a positive EPS surprise and 64% of S&P 500 companies have reported a positive revenue surprise. Further:
· For Q1 2025, the blended (year-over-year) earnings growth rate for the S&P 500 is 10.1%. If 10.1% is the actual growth rate for the quarter, it will mark the second-straight quarter of double-digit earnings growth reported by the index.
· On March 31, the estimated (year-over-year) earnings growth rate for the S&P 500 for Q1 2024 was also 7.2%. Seven sectors are reporting higher earnings today (compared to March 31) due to positive EPS surprises.
· For Q2 2025, 10 S&P 500 companies have issued negative EPS guidance and 12 S&P 500 companies have issued positive EPS guidance.
· The forward 12-month P/E ratio for the S&P 500 is 19.8. This P/E ratio is below the 5-year average (19.9) but above the 10-year average (18.3).

Consumer Confidence Plunged Again in April for the 5th Month in a Row
The Conference Board Consumer Confidence Index fell by 7.9 points in April to 86.0 (1985=100).
· The Present Situation Index – based on consumers’ assessment of current business and labor market conditions – decreased 0.9 points to 133.5.
· The Expectations Index – based on consumers’ short-term outlook for income, business, and labor market conditions – dropped 12.5 points to 54.4, the lowest level since October 2011 and well below the threshold of 80 that usually signals a recession ahead.
“Consumer confidence declined for a fifth consecutive month in April, falling to levels not seen since the onset of the COVID pandemic. The decline was largely driven by consumers’ expectations. The three expectation components – business conditions, employment prospects, and future income – all deteriorated sharply, reflecting pervasive pessimism about the future. Notably, the share of consumers expecting fewer jobs in the next six months (32.1%) was nearly as high as in April 2009, in the middle of the Great Recession. In addition, expectations about future income prospects turned clearly negative for the first time in five years, suggesting that concerns about the economy have now spread to consumers worrying about their own personal situations. However, consumers’ views of the present have held up, containing the overall decline in the Index.”

April’s fall in confidence was broad-based across all age groups and most income groups. The decline was sharpest among consumers between 35 and 55 years old, and consumers in households earning more than $125,000 a year. The decline in confidence was shared across all political affiliations.
Leading Economic Index Falls in March
The Conference Board Leading Economic Index for the US declined by 0.7% in March 2025 to 100.5 (2016=100), after a decline of 0.2% (revised up from –0.3%) in February. The LEI also fell by 1.2% in the six-month period ending in March 2025, a smaller rate of decline than its –2.3% contraction over the previous six months (March–September 2024).
“The US LEI for March pointed to slowing economic activity ahead. March’s decline was concentrated among three components that weakened amid soaring economic uncertainty ahead of pending tariff announcements: 1) consumer expectations dropped further, 2) stock prices recorded their largest monthly decline since September 2022, and 3) new orders in manufacturing softened. That said, the data does not suggest that a recession has begun or is about to start. Still, the Conference Board downwardly revised our US GDP growth forecast for 2025 to 1.6%, which is somewhat below the economy’s potential. The slower projected growth rate reflects the impact of deepening trade wars, which may result in higher inflation, supply chain disruptions, less investing and spending, and a weaker labor market.”
Coincident and Lagging Indexes
The Conference Board Coincident Economic Index for the US increased by 0.1% in March 2025 to 114.4, after a 0.3% increase in February. The CEI rose by 0.8% over the six-month period between September 2024 and March 2025, up slightly from its 0.7% growth over the previous six months.
The Conference Board Lagging Economic Index for the US decreased by 0.1% to 119.1 in March 2025, after a 0.3% increase in February. Despite the monthly downtick, the LAG’s six-month growth rate remained positive at 0.7% between September 2024 and March 2025 – a reversal of its –0.7% decline over the previous six months (March–September 2024).
The LEI declined further in March 2025

Existing Home Sales Drop in March
Existing-home sales descended in March, according to the National Association of Realtors. Sales slid in all four major U.S. regions. Year-over-year, sales dropped in the Midwest and South, increased in the West and were unchanged in the Northeast.
Total existing home sales – completed transactions that include single-family homes, townhomes, condominiums and co-ops – fell 5.9% from February to a seasonally adjusted annual rate of 4.02 million in March. Year-over-year, sales drew back 2.4% (down from 4.12 million in March 2024).
"Home buying and selling remained sluggish in March due to the affordability challenges associated with high mortgage rates.
Residential housing mobility, currently at historical lows, signals the troublesome possibility of less economic mobility for society."

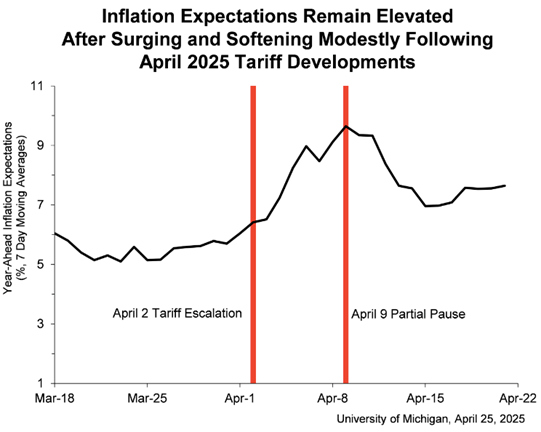
Consumer Sentiment Plunges
“Consumer sentiment fell for the fourth straight month, plunging 8% from March. While the April decline in current conditions was modest, the expectations index plummeted with drop-offs in personal finances as well as business conditions.
Expectations have fallen a precipitous 32% since January, the steepest three-month percentage decline seen since the 1990 recession. While this month’s deterioration was particularly strong for middle-income families, expectations worsened for vast swaths of the population across age, education, income, and political affiliation.
Consumers perceived risks to multiple aspects of the economy, in large part due to ongoing uncertainty around trade policy and the potential for a resurgence of inflation looming ahead. Labor market expectations remained bleak. Even more concerning for the path of the economy, consumers anticipated weaker income growth for themselves in the year ahead. Without reliably strong incomes, spending is unlikely to remain strong amid the numerous warnings signs perceived by consumers.”
Author: FMeX
Published: 5/5/2025
Sources: bea.gov; conference-board.org; umich.edu; factset.com; nar.realtor; msci.com; fidelity.com; nasdaq.com; wsj.com; morningstar.com; conference-board.org
Important Disclosures: Information presented is believed to be factual and up to date. It should not be regarded as a complete analysis of the subjects discussed. Different types of investments involve varying degrees of risk. All investment strategies have the potential for profit or loss. Past performance is not a reliable indicator of current and future results. The information presented herein is intended for educational purposes only and is in no way intended to be interpreted as investment advice or as a device with which to ascertain investment decisions or an investment approach. The specifics of the activity presented by the EWM Asset Management team is intended for general information only. The actual impact to your personal portfolio is not represented by the statements made in this document and you should proactively review your monthly/quarterly statements or contact the office to speak to an Advisor to validate your specific transactions. The S&P 500 is an unmanaged index used as a general measure of market performance. You cannot invest directly in an index. Accordingly, performance results for investment indexes do not reflect the deduction of transaction and/or custodial charges or the deduction of an investment-management fee, the incurrence of which would have the effect of decreasing historical performance results. Any charts, graphs, or visual aids presented herein are intended to demonstrate concepts which cannot be fully explained without the assistance of a professional from EWM. Readers should not in any way interpret these visual aids as a device with which to ascertain investment decisions or an investment approach. Only your professional adviser should interpret this information.