
Global Market Commentary – A Hot August
- Sep 8, 2025
- 9 min read

U.S. Markets Hit New Records in August
In August, investors weighed a mix of upbeat growth figures and lingering inflation pressures. The U.S. economy showed renewed strength, with the second estimate of second-quarter GDP reporting a 3.3% annualized increase, rebounding sharply from the prior quarter’s contraction. Inflation data offered a tempered picture: July’s CPI rose 0.2% from the prior month and 2.7% year-over-year, signaling moderation but still underscoring persistent price pressures.
Corporate earnings also helped shape the market narrative. The S&P 500 posted 11.9% year-over-year earnings growth in the second quarter, marking the third consecutive period of double-digit expansion. Still, management teams struck a cautious tone – FactSet noted that nearly half of companies providing guidance projected weaker earnings for the third quarter, reflecting uncertainty about demand and costs.
Beyond earnings, sector and style performance revealed an interesting rotation. Large-cap growth names cooled slightly as investors trimmed positions after a strong run earlier in the year, while small-cap stocks surged, benefiting from expectations of continued domestic growth and relative insulation from global trade tensions. Cyclical sectors tied to economic expansion – including financials and industrials – generally outperformed, suggesting confidence that the GDP rebound could extend into the second half of the year. Defensive sectors, such as utilities and staples, lagged as risk appetite increased.
At the same time, consumer and housing data injected fresh concerns. The University of Michigan’s sentiment index fell to 58.6 in August, down from 61.7 in July, as short-term inflation expectations ticked higher and confidence in durable-goods purchases weakened. Pending home sales added to the unease, slipping 0.4% month-over-month even as they edged up slightly from a year earlier.
Against this backdrop, equities managed to advance across the board and for the month of August all four major U.S. indexes posted gains for the fourth straight month, as:
· The Dow Jones Industrial Average rose 1.9%;
· The S&P 500 gained 1.2%;
· NASDAQ climbed 1.4%; and
· The Russell 2000 leapt 6.0%.
Global Markets Rally as Oil Declines
Global markets outperformed U.S. equities in August, though results showed a slight divergence between developed and emerging economies. Developed international equities delivered broad-based strength, with 49 of 50 MSCI developed market indices posting gains, extending the positive trend that has characterized much of 2025.
Emerging markets also advanced meaningfully, as 39 of 46 MSCI emerging market indices finished higher. Their performance was underpinned by supportive macro conditions: easing trade frictions, solid corporate earnings in critical industries, and growing expectations that central banks in key regions will continue to adopt more accommodative stances as the year progresses.
Volatility remained largely contained, helping sustain a constructive backdrop for risk assets. While geopolitical headlines caused brief spikes early in the month, the CBOE Volatility Index (VIX) stabilized quickly, continuing the downward trend from April, when volatility had surged amid tariff-related uncertainty.
Commodities reflected this risk-on environment in mixed ways. West Texas Intermediate crude oil fell $5.99 to $64.01 per barrel, an 8.6% monthly decline that leaves prices roughly 12% lower year-to-date. In contrast, gold advanced nearly 5%, supported by a weaker dollar and growing expectations for future Federal Reserve rate cuts.

Market Performance Around the World
Investors who looked abroad in August saw mostly favorable results, though performance varied across regions. Developed markets were broadly stronger, with 49 of 50 MSCI-tracked indices posting advances, most of them greater than 4%. Along the same lines, emerging markets delivered solid outcomes too, as 39 of 46 indices advanced, including 11 with gains above 3%. This sharp contrast highlights the uneven pace of recovery across the global economy and equity markets.
Index Returns | August 2025 |
MSCI EAFE | +4.06% |
MSCI EUROPE | +3.24% |
MSCI FAR EAST | +6.46% |
MSCI G7 INDEX | +2.31% |
MSCI NORTH AMERICA | +1.99% |
MSCI PACIFIC | +5.72% |
MSCI PACIFIC EX-JAPAN | +3.34% |
MSCI WORLD | +2.49% |
MSCI WORLD ex USA | +4.21% |
Source: MSCI. Past performance cannot guarantee future results
Sector Performance Was Strong
Sector performance moderated somewhat in August following two months of broad strength. In July, 9 of 11 S&P 500 sectors posted gains, but in August, leadership narrowed, although 10 sectors advanced. The shift marked a more uneven landscape compared to June and July, when momentum was widespread and gains were more robust.
The pace of performance also cooled. Information Technology, which surged +6.51% in July, barely moved in August, adding only +0.18%. Meanwhile, areas that had struggled earlier regained some footing: Health Care rebounded from a marginal July decline to rise +1.44%, and Consumer Staples climbed +0.67% after a two-month slide. Housing-sensitive Real Estate also remained positive, though its +0.51% gain was more muted than July’s +2.26%.
On the other end of the spectrum, Industrials – a July standout with a +3.47% gain – turned negative, dropping -1.77% in August as cyclical momentum faded. By contrast, Communication Services delivered the strongest result, surging +5.51%, its best showing in several months. Materials and Financials also strengthened, advancing +2.11% and +1.57%, respectively, underscoring continued support for economically sensitive sectors.
The divergence across sectors illustrates a market searching for new leadership after broad-based rallies earlier in the summer. Defensive areas like Utilities cooled from July’s +4.68% surge to just +0.39%, while cyclical and growth-oriented segments produced mixed outcomes. Taken together, August highlighted both the durability of market breadth and the growing dispersion of returns across sectors.
Below is a breakdown of sector returns for July and August, illustrating both the short-term volatility and the importance of a differentiated view when evaluating market leadership:
S&P 500 Sector | July 2025 | August 2025 |
Information Technology | +6.51 | +0.18% |
Energy | +2.75% | +1.89% |
Health Care | -0.04% | +1.44% |
Real Estate | +2.26% | +0.51% |
Consumer Staples | -1.49% | +0.67% |
Consumer Discretionary | +2.12% | +1.62% |
Industrials | +3.47% | -1.77% |
Financials | +1.33% | +1.57% |
Materials | +0.59% | +2.11% |
Communication Services | +0.56% | +5.51% |
Utilities | +4.68% | +0.39% |
Source: FMR
GDP in 2Q2025 Revised Up 3.3%
In the second quarter of 2025 (April–June), real Gross Domestic Product (GDP) increased at an annual rate of 3.3%, according to the BEA’s second estimate. This represents an upward revision from the 3.0% advance estimate and follows a 0.5% contraction in the first quarter.

The rise in GDP primarily reflected a decrease in imports – which, as a subtraction in the GDP formula, contributes positively when falling – and an increase in consumer spending. These increases were partly offset by decreases in investment and exports.
Other related indicators showed that real final sales to private domestic purchasers (excluding inventory changes) also rose 1.2%. The gross domestic purchases price index increased 1.9%, while the PCE (Personal Consumption Expenditures) price index rose 2.1%, and the PCE index excluding food and energy gained 2.5%.
July Inflation Up 0.2%, Driven by Shelter
In July 2025, the Consumer Price Index for All Urban Consumers (CPI-U) rose 0.2% on a seasonally adjusted basis and increased 2.7% over the past 12 months, not seasonally adjusted. The core CPI (all items less food and energy) rose 0.3% in July and was up 3.1% year-over-year.
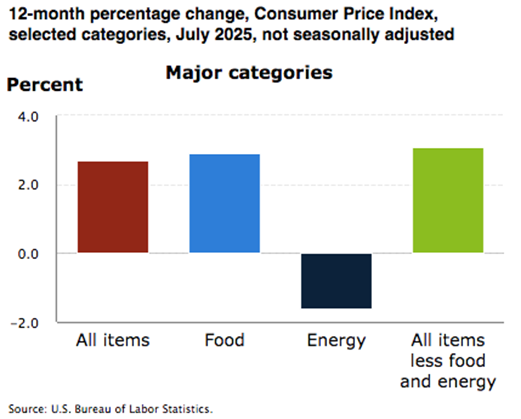
Looking at components within core CPI, notable details include shelter, which rose 0.2% for the month, with owners’ equivalent rent and rent each up 0.3%. Medical care increased 0.7%, including dental services up 2.6%, hospital services up 0.4%, and physicians’ services up 0.2%, while prescription drugs fell 0.2%.
Other contributors: airline fares climbed 4.0%, recreation and household furnishings/operations both rose 0.4%, used cars and trucks up 0.5%, personal care up 0.4%, new vehicles were unchanged, and communication services fell 0.3%.
Outside core, the energy index decreased 1.1% in July, as gasoline dropped 2.2%, electricity dipped 0.1%, and natural gas declined 0.9%. Over the year, energy is down 1.6%, with gasoline down 9.5%, fuel oil down 2.9%, electricity up 5.5%, and natural gas up 13.8%.
Strong Corporate Earnings Continue
Research firm FactSet released the following key metrics for companies within the S&P 500 as of August 29th:
Earnings Scorecard: For Q2 2025 (with 98% of S&P 500 companies reporting actual results), 81% of S&P 500 companies have reported a positive EPS surprise and 81% of S&P 500 companies have reported a positive revenue surprise.
Earnings Growth: For Q2 2025, the blended (year-over-year) earnings growth rate for the S&P 500 is 11.9%. If 11.9% is the actual growth rate for the quarter, it will mark the third consecutive quarter of double-digit earnings growth for the index.
Earnings Revisions: On June 30, the estimated (year-over-year) earnings growth rate for the S&P 500 for Q2 2025 was 4.8%. Nine sectors are reporting (or have reported) higher earnings today (compared to June 30) due to positive EPS surprises.
Earnings Guidance: For Q3 2025, 46 S&P 500 companies have issued negative EPS guidance and 52 S&P 500 companies have issued positive EPS guidance.
Valuation: The forward 12-month P/E ratio for the S&P 500 is 22.4. This P/E ratio is above the 5-year average (19.9) and above the 10-year average (18.5).
Consumer Sentiment Slows in August
Consumer sentiment cooled in August – dropping approximately 6% from July to a reading of 58.2, and marking the first decline after several months of gains. While sentiment remained higher than the low levels seen in April and May, it still trailed readings from six and twelve months ago.
Notably, confidence in buying durable goods hit its lowest point in a year, and households reported a 7% decline in assessments of their current financial situation, primarily due to concerns about rising prices. Expectations for both business conditions and the labor market also weakened, though personal financial expectations held relatively steady despite remaining subdued.

Retail Sales Jump in July
In July 2025, total retail and food services sales reached an estimated $726.3 billion, reflecting a 0.5% increase compared to June, and a 3.9% increase from July 2024. The data for June was revised upward: June’s sales are now reported at $722.6 billion, marking a 0.9% gain from May, higher than previously estimated.

Over the three-month span from May through July 2025, sales were 3.9% higher than the same period in 2024. Looking at the retail-only category (excluding food services), sales increased 0.7% from June and 3.7% year-over-year.
Notably, nonstore retailers (such as online outlets) posted an 8.0% year-over-year increase, while food services and drinking places rose 5.6% over the past year.
Pending Home Sales Drop
In July 2025, the U.S. Pending Home Sales Index declined by 0.4% month-over-month, with signed contracts for previously owned homes falling more than economists had expected. On an annual basis, pending home sales were up 0.7% year-over-year.
Regionally, the data showed differing momentum across the U.S. In the Northeast, pending home sales decreased 0.6% month-over-month and were down 0.6% year-over-year. The Midwest experienced a sharper drop of 4.0% month-over-month, but still posted a 1.3% annual gain. The South held relatively steady with a 0.1% monthly decrease but 1.8% growth year-over-year. In the West, pending sales rose 3.7% from June, though year-over-year they fell 1.9%.
Also included in NAR’s report, the Realtors Confidence Index survey revealed that 16% of members expected buyer traffic to increase over the next three months (unchanged from a year ago), while 21% expected an increase in seller traffic, up from 17% in July 2024.

A Mixed Picture of Manufacturing
The July 2025 Dallas Fed Texas Manufacturing Outlook Survey presented signs of a strong rebound. Production surged to 21.3, the highest level in more than three years, while capacity utilization and shipments both moved into positive territory. Although new orders remained slightly negative at –3.6, they improved significantly from the prior month.
In contrast, the Richmond Fed’s July 2025 survey painted a far weaker picture for the Fifth District. The composite index fell to –20 from –8, with steep declines in shipments (–18), new orders (–25), and employment (–16). Local business conditions remained negative, though they improved modestly, and six-month outlooks showed stabilization.

Author: FMeX
Published: 9/8/2025
Sources: bea.gov; bls.gov; dallasfed.org; richmondfed.org; nar.realtor; factset.com; msci.com; fidelity.com; nasdaq.com; wsj.com; morningstar.com
Important Disclosures: Information presented is believed to be factual and up to date. It should not be regarded as a complete analysis of the subjects discussed. Different types of investments involve varying degrees of risk. All investment strategies have the potential for profit or loss. Past performance is not a reliable indicator of current and future results. The information presented herein is intended for educational purposes only and is in no way intended to be interpreted as investment advice or as a device with which to ascertain investment decisions or an investment approach. The specifics of the activity presented by the EWM Asset Management team is intended for general information only. The actual impact to your personal portfolio is not represented by the statements made in this document and you should proactively review your monthly/quarterly statements or contact the office to speak to an Advisor to validate your specific transactions. The S&P 500 is an unmanaged index used as a general measure of market performance. You cannot invest directly in an index. Accordingly, performance results for investment indexes do not reflect the deduction of transaction and/or custodial charges or the deduction of an investment-management fee, the incurrence of which would have the effect of decreasing historical performance results. Any charts, graphs, or visual aids presented herein are intended to demonstrate concepts which cannot be fully explained without the assistance of a professional from EWM. Readers should not in any way interpret these visual aids as a device with which to ascertain investment decisions or an investment approach. Only your professional adviser should interpret this information. This material is published and distributed by Financial Media Exchange for informational and educational purposes only. It is not intended as investment advice or a recommendation to buy or sell any security. Investing involves risk, including the potential loss of principal. Past performance is not indicative of future results. Investment returns and principal value will fluctuate, and you may have a gain or loss when you sell your investment. Current performance may be higher or lower than the performance data quoted. The information presented is believed to be reliable but is not guaranteed. You should consult your own financial professional before making any investment decisions. This content complies with SEC and FINRA guidelines for educational communications and does not promote any specific products or strategies.